Exploring Potential Energy Surface of NH3 and PH3, Part 2. Minimum Energy Path.
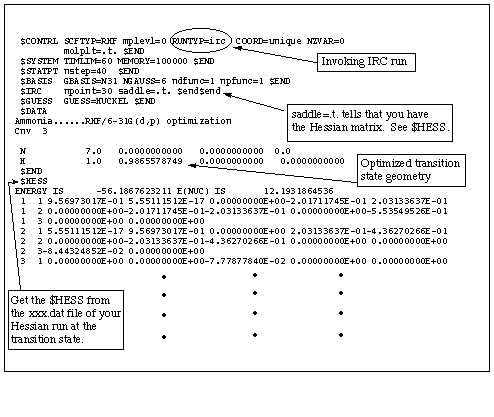
In this excercise, we are going to learn how to follow minimum energy path of ammonia inversion motion. The minimum energy path following subroutines in GAMESS are invoked by the keyword, RUNTYP=IRC, in the $CONTRL group. You need the optimized geometry at the transition state in order to start the IRC run. In addition to the geometry, you also need the Hessian at the transition state. The hessian matrix can be obtained from the xxx.dat file of your Hessian run at the transition state. The following input deck shows you the important modification that you have to make for your IRC calculations.
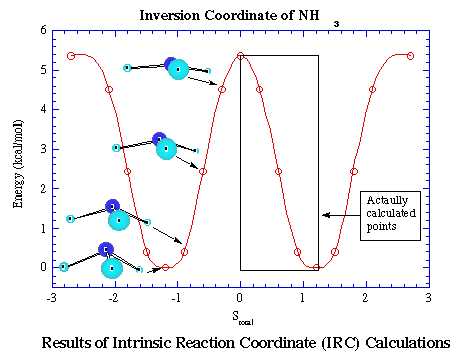
From this exercise, you can make several plots that are similar to the one shown above. Only four points are calculated to elucidate the minimum energy path of the inversion of ammonia. The energy at the transition state is not included, so you have to get the energy from your optimization or your Hessian run. What you should do is to construct the double-well potential energy curve by inverting the data points.
How does the geometry change from the transition state to the minimum? You can get these information by examining the bond length, bond angle, and dihedral angles of the molecule at each IRC point. You should prepare the table showing these quatities at each IRC point.
By plotting the results obtained with the RHF/6-31G(d,p) and MP2/6-31G(d,p), you should be able to tell the difference with the different methods. What is the difference or similarity? Plot both the NH3 and PH3 IRC with respect to the Stotal, the arc length from the transition state. What are the difference and similarity of the IRC in NH3 and PH3? What can you say about vibrational frequencies when you compare NH3 and PH3 in this coordinate?
If you need a molecular visualization software for this report. Please let me know. I have one on my Mac.