Failure of Classical Physics
Toward the end of 19th century, physics was highly successful. Thought to be nearly completed in understanding the physical world, and the future generation was to push the limits of accuracy to larger decimal places.
.... except some minor details.
1. Black-body radiation
2. Heat capacity
3. Atomic and molecular spectra
4. Photoelectric effect
5. Is light wave or particle?
These allegedly minor details were to transform the view of our world completely different, leading to quantum mechanics. Let us look at these in more details.
Black-Body Radiation
Discovery of Electron
As we know, gas is generally an insulator. However, with high electrical tension, gas becomes conducting. A good example is lightening storm.
Conduction of gas with high electrical tension can be produced in a laboratory environment using Crooks tube. It contains low-pressure noble gas in a closed glass tube containing two conducting plates at two ends, which are connected to a battery to create high voltage across the plates.
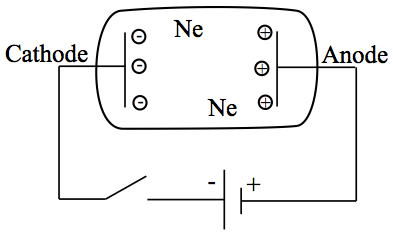
Figure 1. Crooks tube.
A neon sign is made using this principle.
Jean Perrin (France) inserted a metal plate to Crooks tube, and observed that the inserted plate acquired negative charge. In 1897, J J Thomson modified Crooks tube further, as shown in Figure 2.
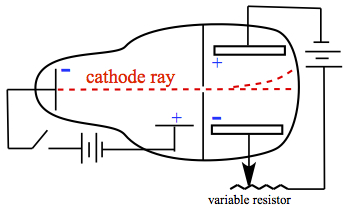
Figure 2. Thomson's cathode ray tube.
Thomson's idea was to subject the cathode ray with electric field and magnetic field to see the response. If cathode ray was charged, one would observe deflection by electric and magnetic fields. In the electric field, the cathode ray was deflected toward the positive side of the plate. In the case of effect of magnetic field, Thomson placed a magnet as shown in Figre 3.
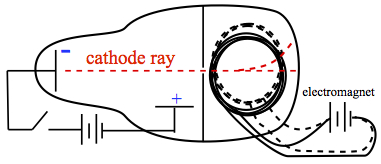
Figure 3. Thomson's cathode ray tube with magnet.
Lorentz cleaned up the mathematics that was originally provided by Thomson, and the force incurred on the cathode ray is now given by Lorentz force,
| 2 |
Cathode Ray in Electric Field
Let us look at electric field effect first. Starting with the Newton's law of motion, Fe = ma. Fe indicates the force due to electric field.| 3 |
If the deflection y is expanded in Taylor series at y0 in t, but truncated at the second order in t, one gets
| 4 |
| 5 | |
| 6 |
The deflection is initially zero, thus y0 = 0 and v0 = 0. So, the expansion is
| 7 |
Since the accerelation is given in Eqn. 3, we have
| 8 |
If we assume the motion in the x direction to be constant motion, then x = vxt and a = 0. Thus,
| 9 |
| 10 |
Therefore, the deflection is proportional to
| 11 |
Cathode Ray in Magnetic field
Now, we examine the second term in Eqn. 2. We follow the analogous arguments above. The Newton's law of motion in magnetic field is Fb = ma.
| 12 |
| 13 |
| 14 |
| 15 |
Charge to Mass Ratio
In both cases, deflection by electric field and magnetic field, the quantity e/m can be deduced from the experiment. J.J. Thomson in 1897 calculated the e/m or charge to mass ratio. The value of e/m today is 1.76 x 10¹¹ C/kg. The observation are consistent with the cathode ray has negative charge, and today we call it, electron.
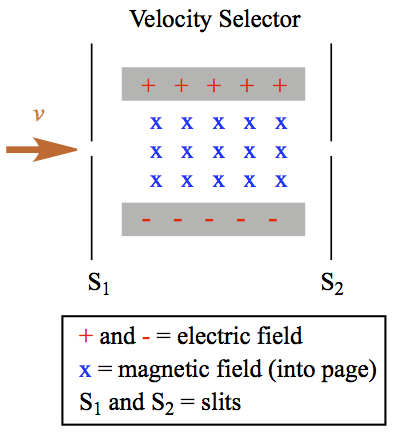
When a charged, say positive, particle comes in from left after passing through the slit 1, S1, the charged particle feel a force of electric and magnetic field that are lined up according to Figure C1.
 |
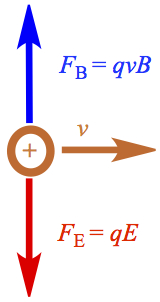 |
| Figure C1. Velocity selector of charged particle. | Figure C2. Charged particle in electric and magnetic fields. |
If only the electric field is turned on, the positively charged particle would feel downward force. If on the other hand, only magnetic field is turned on, upward force would be felt by the particle. In this case the magnetic field is pointing toward the rear of the computer display you're looking at. If and when the electric and magnetic forces are equal,
| C1 |
|
| C2 |
| C3 |
Mass spectrometer is illustrated in Figure C3.
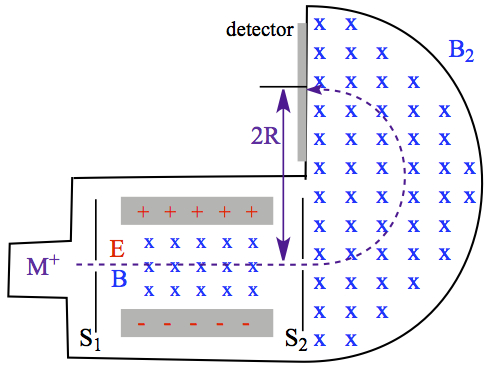
Figure C3. Mass spectrometer.
Molecules injected are ionized generally by electrical discharge, and creating ion, M+. The ion enters into the velocity selector, described above, and after velocity selection the ion enters into a semiciruclar chamber with magnetic field, B2. The ion follows the semicircular path (dashed line) to reach the detector. The observed point is separated to the exiting slit S2 of the velocity selector by a diameter of the semicircle path, labeled 2R, twice the radius.
The magnetic force acting on the ion is F = qvB2. When a mass, m, is in constant circular motion (or constant velocity), it would feel the centripetal acceleration, aC,
| C4 |
| C5 |
| C6 |
Millikan's Oil Drop Experiment
In order to determine the value of the fundamental unit of charge e, Millikan set out to measure it by through the so-called oil drop experiment. The device is set up as follows, in Figure 4.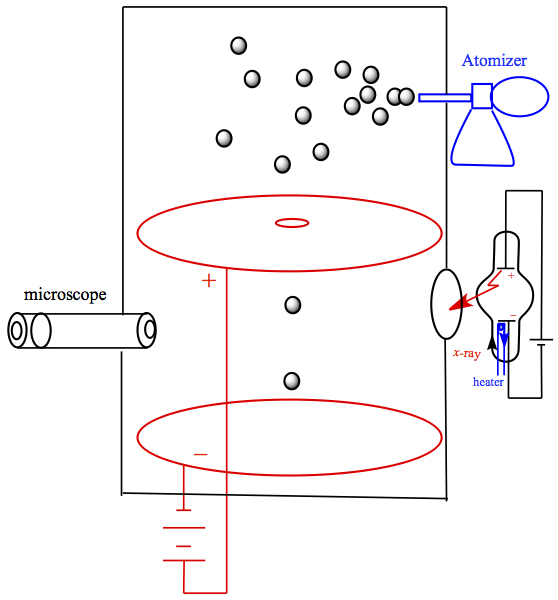
Figure 4. Millikan's Oil Drop Experiment
The temperature controlled box equipped with atomizer containing oil and microscope. When atomizer generates a spray of tiny oil droplets, some of the droplets would fall in a hole on a metal plate that is connected with an electrical source. When these droplets fall due to gravity, one can calculate the radius of droplets by considering drag (Stokes' law) generated by air resistance to fall. The terminal velocity, vf of droplets can be measured by looking into the microscope on the device. The situation is shown in Figure 5a.
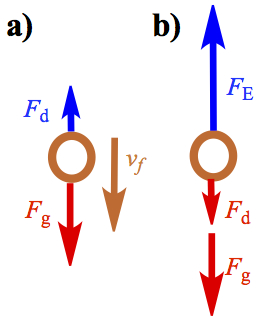
Figure 5. Forces Associated with Oil Drop Experiment. a) Electric field off. b) Electric field on.
The drag force is given by
| 16 |
| 17 |
| 18 |
| 19 |
Now that we have a way to measure radius and mass of droplets, we need to charge it by ionizing the molecules of air by X-ray. The ionized air molecules adheres to the surface of the oil droplets. When electric field is turned on, and adjust the electric field by changing the voltage across the two plates, such a way that the droplet stops downward motion. Then, the electrical force, FE, becomes equal to the downward force of gravity, Fg, and the drag force, Fd. The drag force is now applied to go against the upward motion of droplet.
| 20 |
| 21 |
From the result of e and using the e/m ratio of 1.76 x 10¹¹ C/kg, we can arrive at the mass of electron. The mass of electron is calculated to be 9.10 x 10⁻³¹ kg.
Light
We saw in Chapter 1 that light is electromagnetic wave. History of light being a wave is quite long.
Diffraction of light through single-slit
When the monochromatic light goes through a slit and observed at a distant detector, you might see the intensity of light is as shown below in Figure 5. Note that there are diffraction fringes seen in the figure.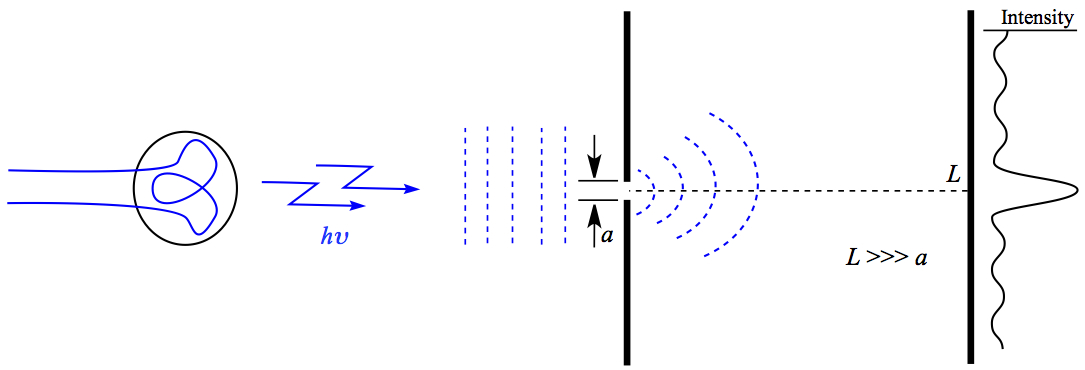
Figure 5. Light through Single-slit.
When the monochromatic light from a source at a distance passing through a narrow slit of dimension a, we can think about a scenario that the light comes in an angle, as shown in Figure 6.
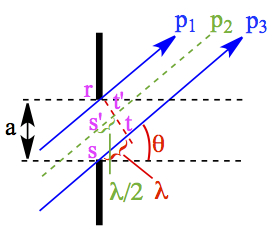
Figure 6. Configuration of Single-slit Experiment.
In comparison to the top beam path, p1, and the bottom one p3, the light has to travel a full wave length, λ, more distance to reach the monitor. Since sin(x) + sin(x + π) = 0, all of the beams from p1 to p2 would be cancelled with the beams from p2 to p3, to have diminished intensity. Similarly, if the two paths p1 and p3 are separated by integral multiple of 1/2 λ, then the beams of p1 to p2 and p2 to p3 are enhanced each other, creating the brighter fringes (or higher intensity). The incident angle, θ can be determined by considering a triangle formed by points, r, s and t. Similarly, Therefore, the maxima and minima of these fringes are given by the following,
| m = 1, 2, 3, ... | 22 | |
| m = 1, 2, 3, 4, ... | 23 |
Most notable experiment is carried out by Young in 1801. Young observed interference pattern when the light is shone on a closely space double-slit as shown below (Figure 7).
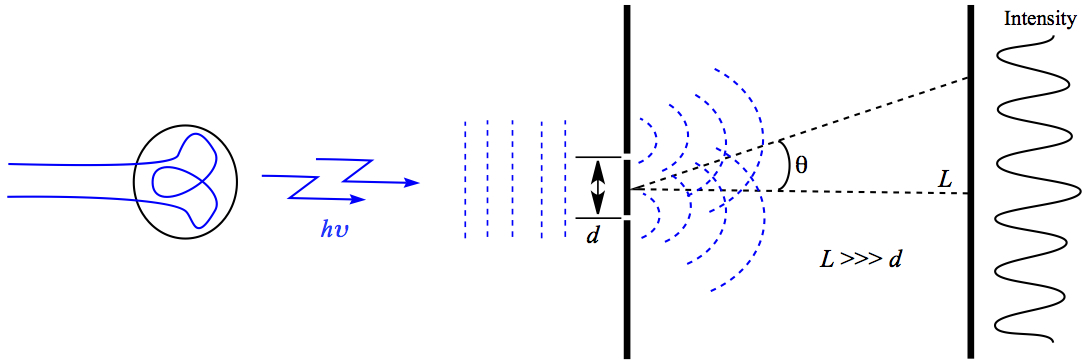
Figure 7. Double-slit Experiment by Young
The geometrical relationship between the wave length, slit geometry, and the angle of approaching beams are shown in Figure 8.
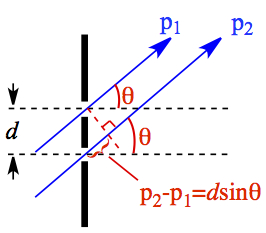
Figure 8. Configuration of Double-slit Experiment.
The brighter fringes are results of constructive interference while the darker fringes are from destructive interference. The interferences are given as a function of several variables,
| m = 0, 1, 2, 3, ... | 24 | |
| m = 0, 1, 2, ... | 25 |
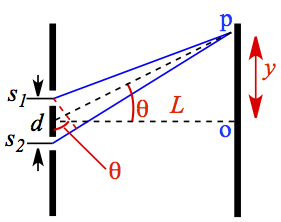
Figure C1. Configuration of Double-Slit Experiment.
The electric field at a point p, which forms the angle θ with the mid point of the two slits, is a superposition of E1 and E2 that are respectively orignated from s1 and s2 slits. Therefore,
| C1 |
| C2 |
| C3 | |
| C4 |
| C5 |
In order to obtain Eθ, we need to construct a phasor diagram, which is to construct a vector model relationship between amplitude, frequency and phase of sinusoidal functions. In our case, it looks like the one shown in Figure C2.
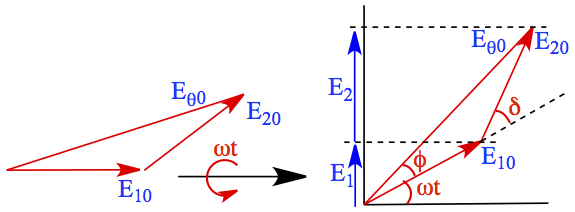
Figure C2. Phasor Diagram.
Assumption: Since the light coming through the two slits should have equal amount of light (E10 = E20 = E0).
The triangle 0-E10 -E20 is an isosceles triangle, then angle φ = δ/2 and Eθ0 is written,
| C6 |
| C7 |
The intensity, Iθ, is proportional to Eθ02, but the relative intensity is to compare Iθ with I0 where θ = δ = 0. So,
| C8 |
| C9 |
Let's take out assumption and generalize it.
In Eqn. C5, δ is dependent on sinθ. According to Figure C1, sinθ = y/L, therefore,
| C10 |
| C11 |